During the recent Cacti configuration I came across a problem where I was not able to read interface traffic, using SNMP, from my Linux servers (I have two Ubuntu 11.10 Servers). Basically my Cacti system wasn’t showing any graphs for any of the ethernet ports on my Linux servers.
Hopefully the following workaround will help whoever has the similar problem.
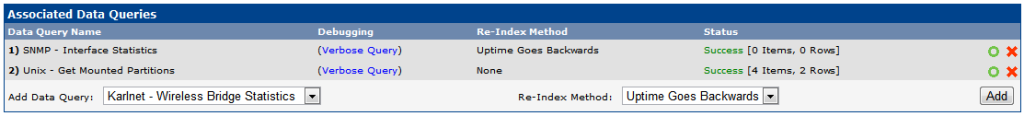
Interface statistics status was always successful, however it wasn’t reading any data, see below.
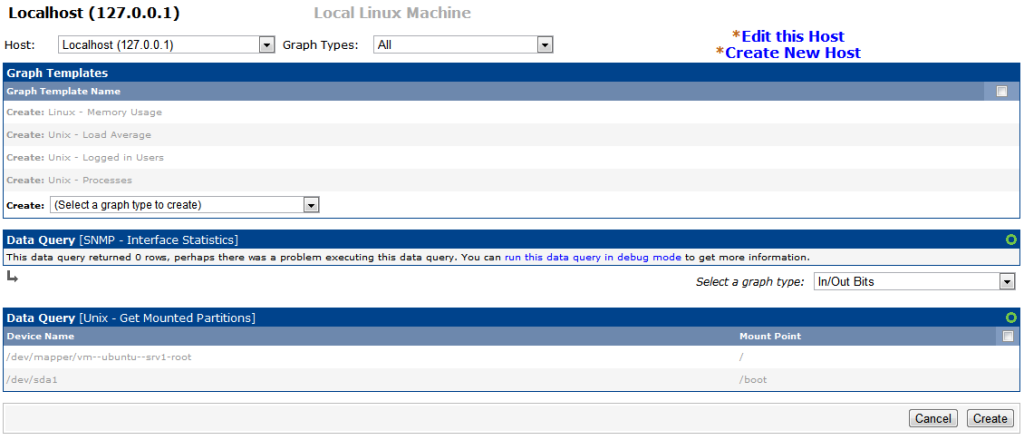
There was not ethernet interface under Data Query [SNMP – Interface Statistics] in the Create New Graph section
I’ve notice that the SNMP data is not captured in the debug mode. In order to enable Data Query Debug Information click on run this data query in the debug mode in the Create New Graph section in the Cacti. You should see something like this:
Data Query Debug Information
+ Running data query [1].
+ Found type = ’3′ [snmp query].
+ Found data query XML file at ‘/usr/share/cacti/site/resource/snmp_queries/interface.xml’
+ XML file parsed ok.
+ Executing SNMP walk for list of indexes @ ‘.1.3.6.1.2.1.2.2.1.1′
+ No SNMP data returned
+ Found data query XML file at ‘/usr/share/cacti/site/resource/snmp_queries/interface.xml’
+ Found data query XML file at ‘/usr/share/cacti/site/resource/snmp_queries/interface.xml’
+ Found data query XML file at ‘/usr/share/cacti/site/resource/snmp_queries/interface.xml’
The problem I found was permissions for SNMP. In order to make this all working I had to amend snmpd.conf file in /etc/snmp/ directory.
I’ve changed actually one line , from
#
# ACCESS CONTROL
#
# system + hrSystem groups only
view systemview included .1.3.6.1.2.1.1
to
#
# ACCESS CONTROL
#
# system + hrSystem groups only
view systemview included .1.3.6.1.2.1.
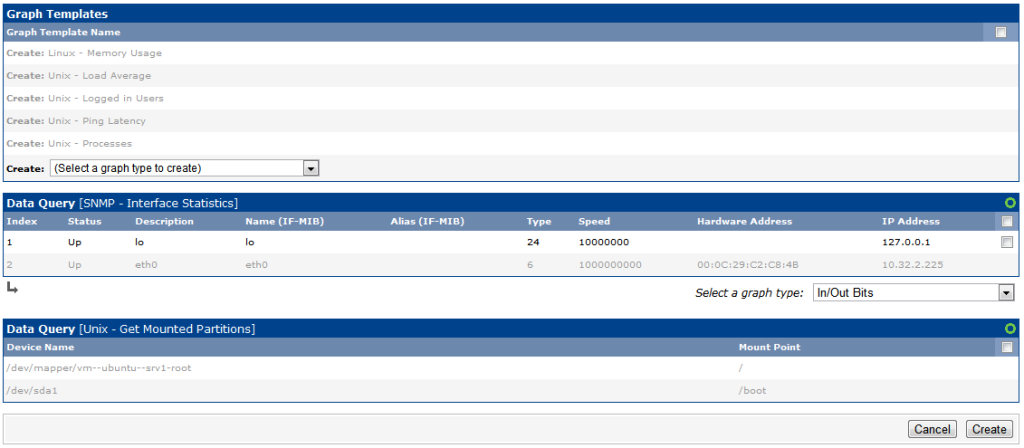
Now all should work properly, and when you run Data Query Debug Information you should see that SNMP interface data has been read correctly.
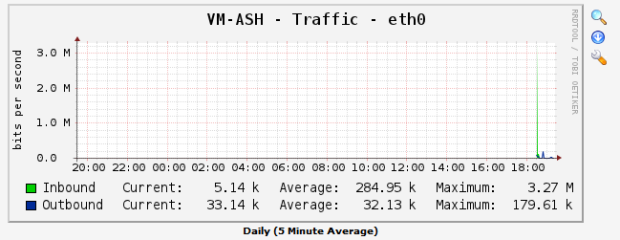
Now you can create a graph for whatever interface your want to monitor. As you can see below, section Data Query [SNMP – Interface Statistics] has two options, I have already selected an interface for monitoring.
After few minutes Cacti should create proper graphs for an interface.